Time-lapse of aerial photos
Contour lines
Tuesday October 11th - November 14th
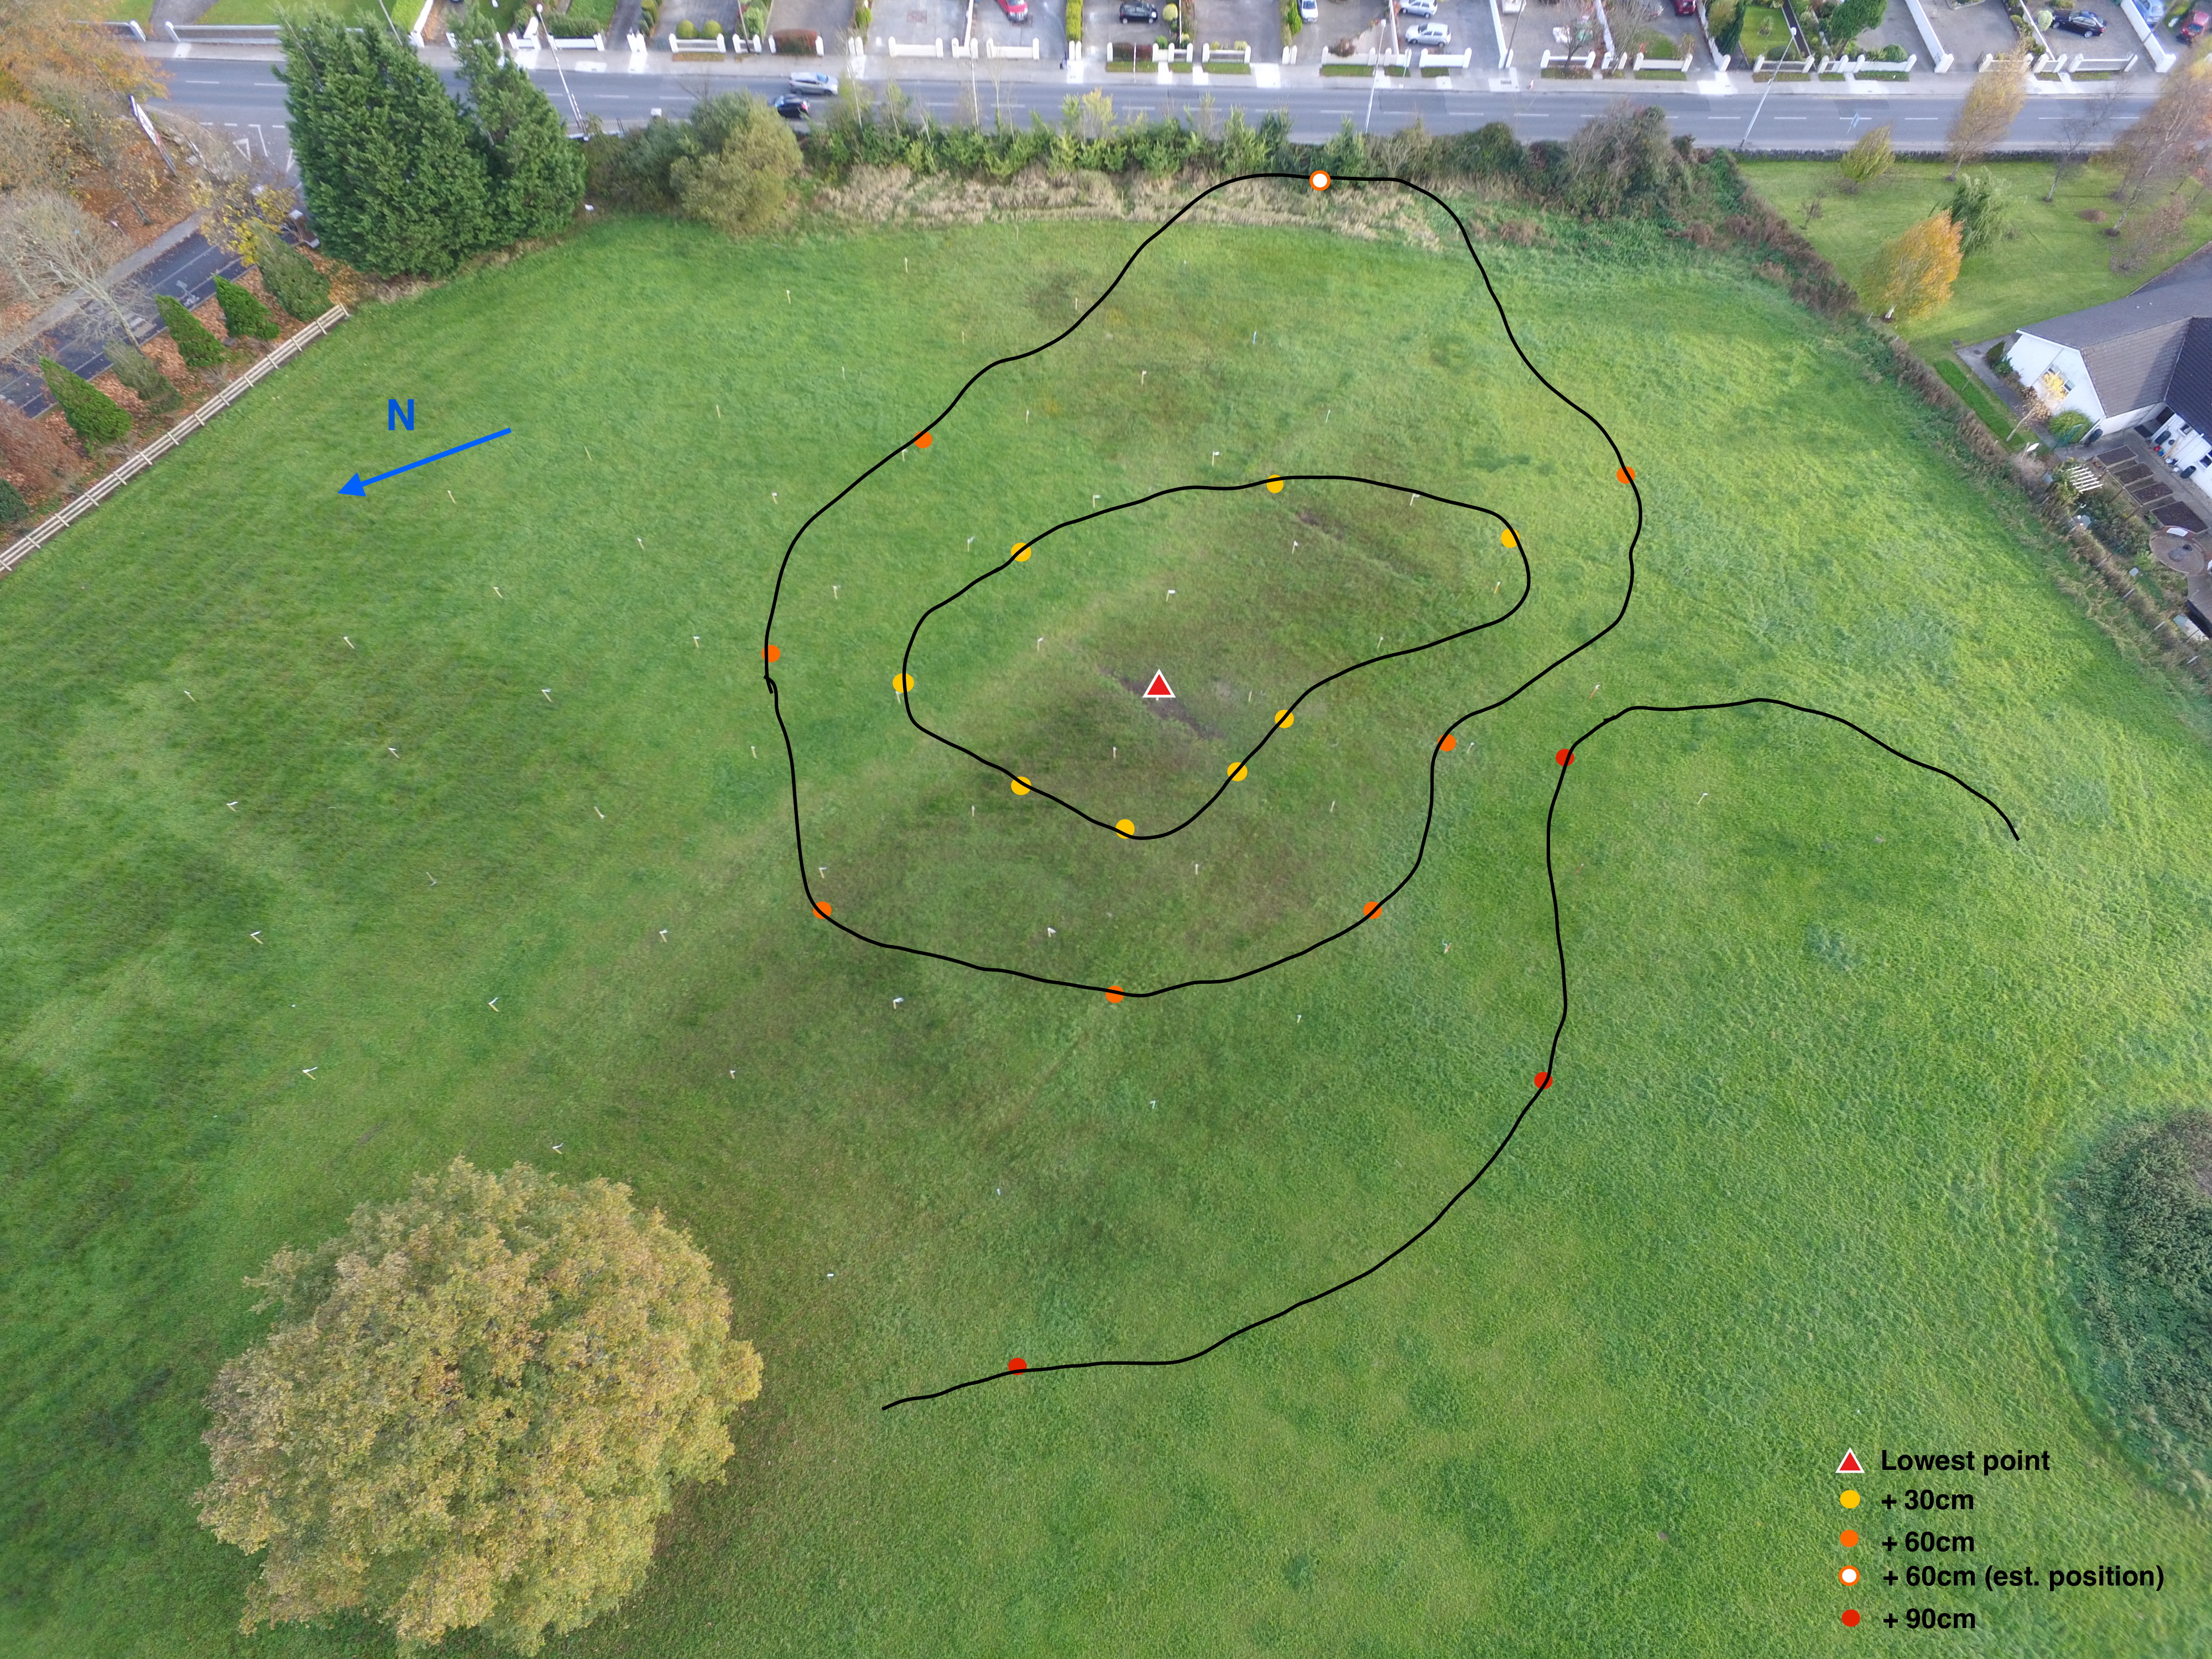
It is only from the air that it all becomes clear when you "join the dots".
*Estimated position of +60cm was due to the land being much flatter towards the Corbally Road.
See written piece by pupil Liam O'Connell here.
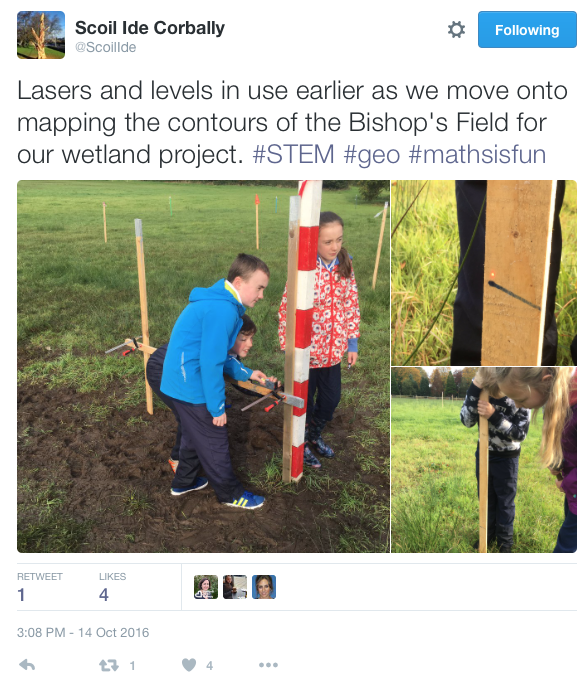
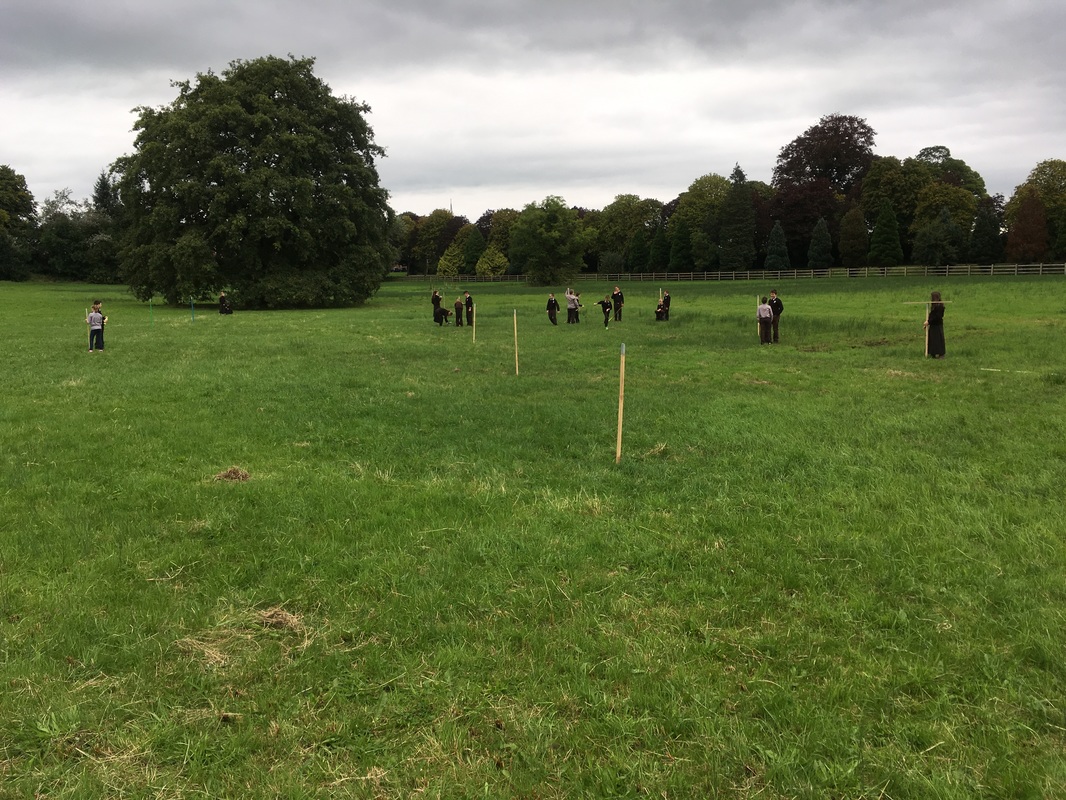
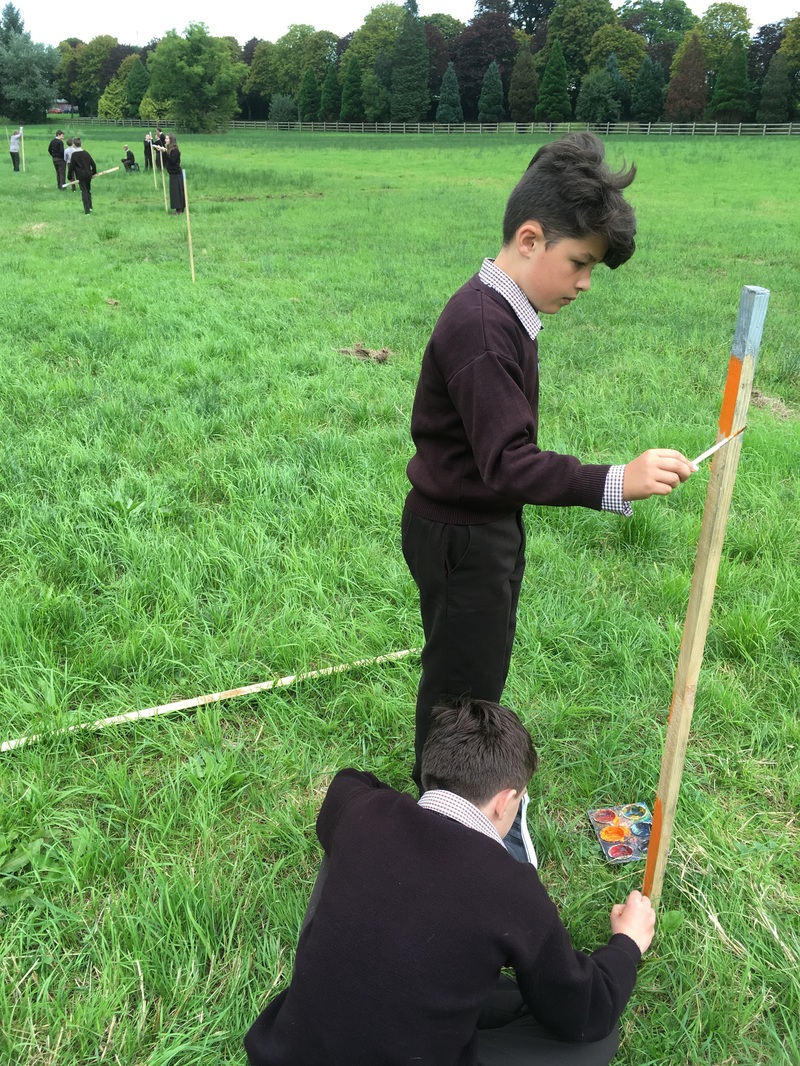
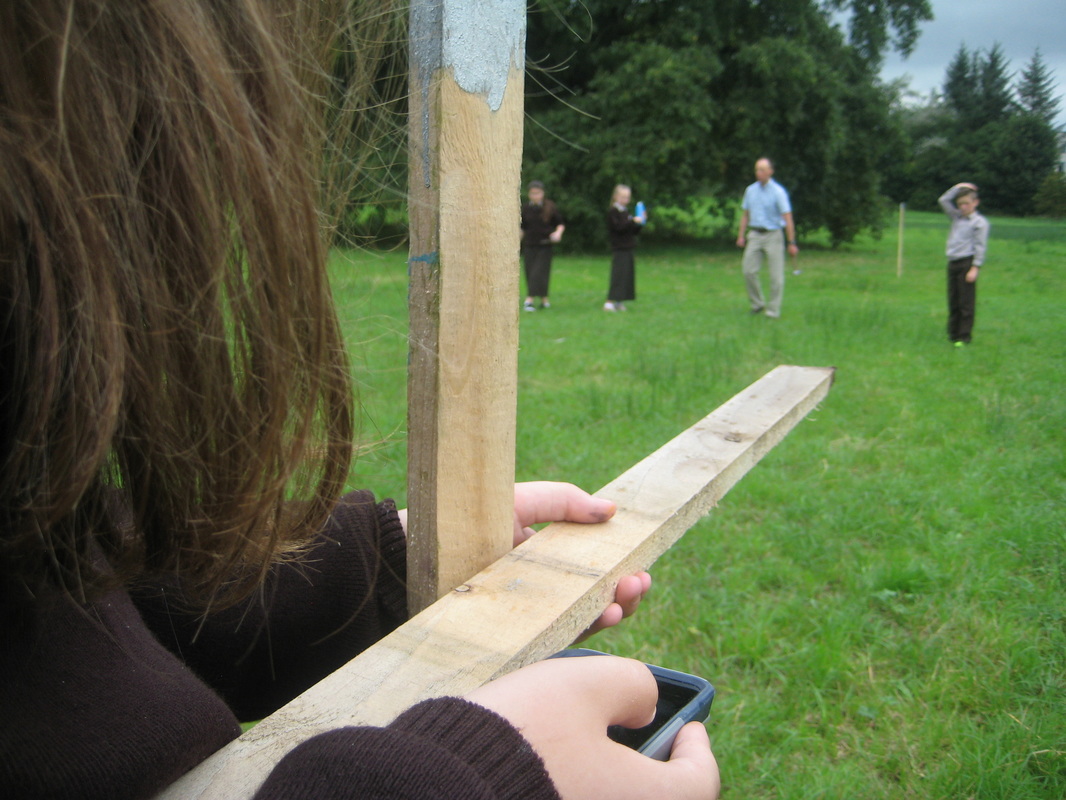
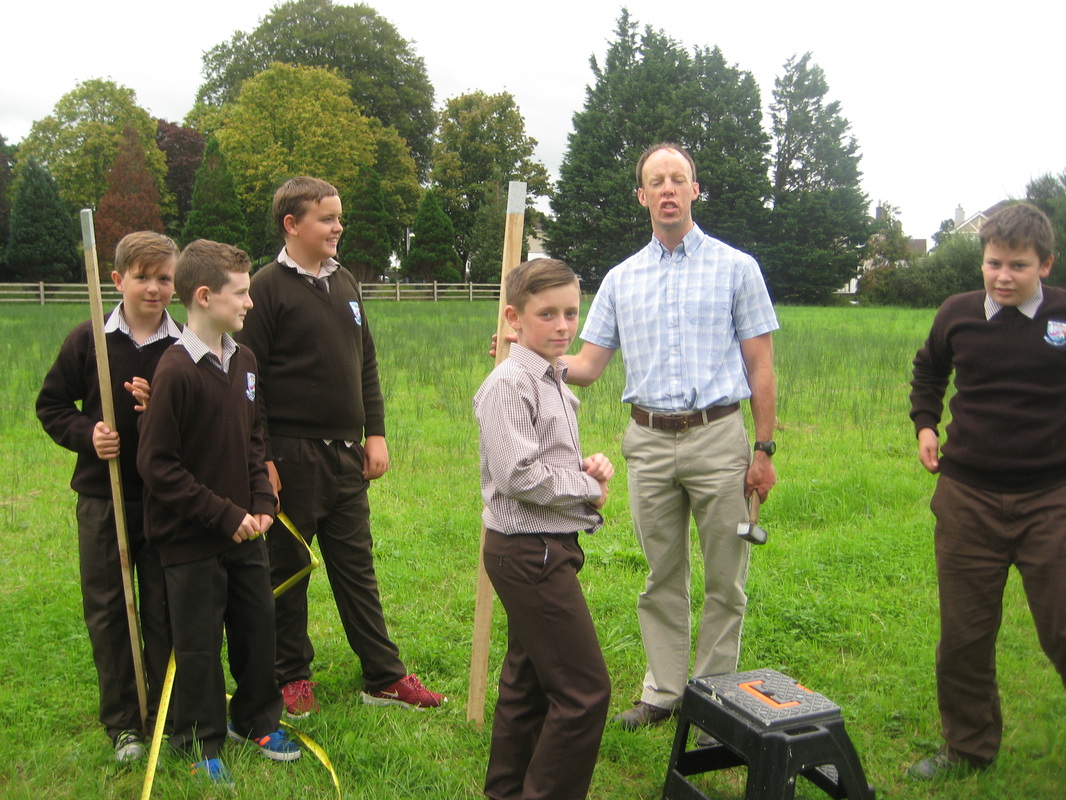
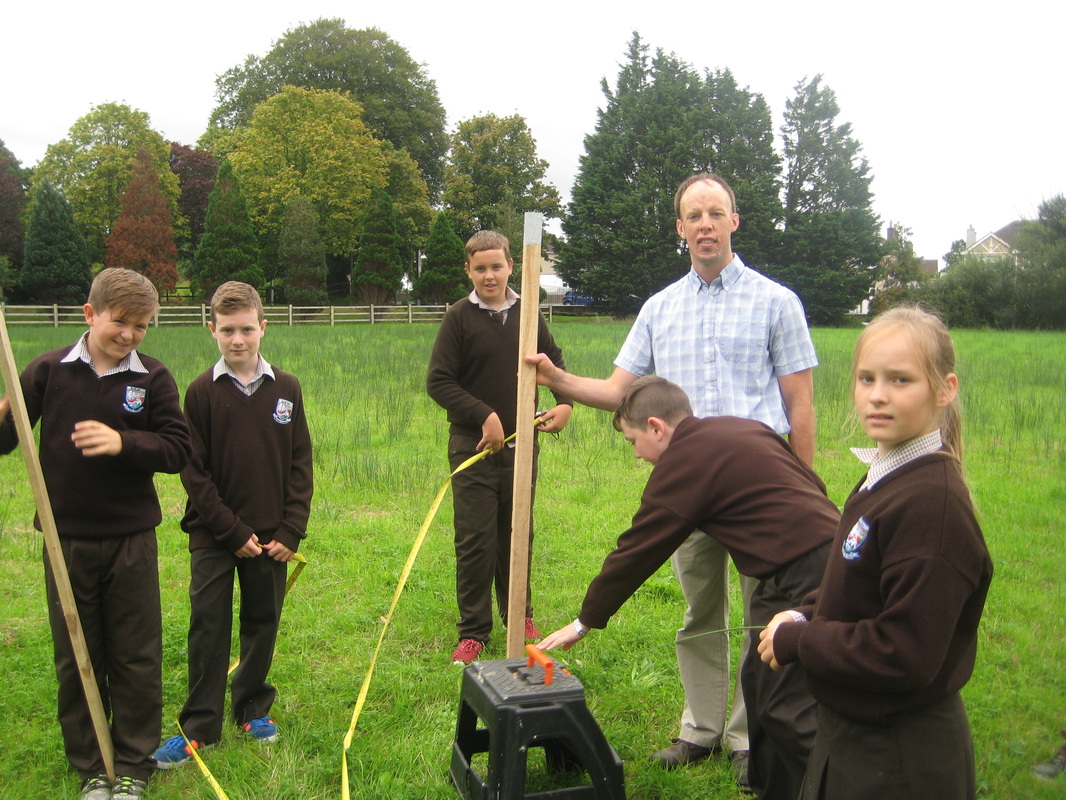
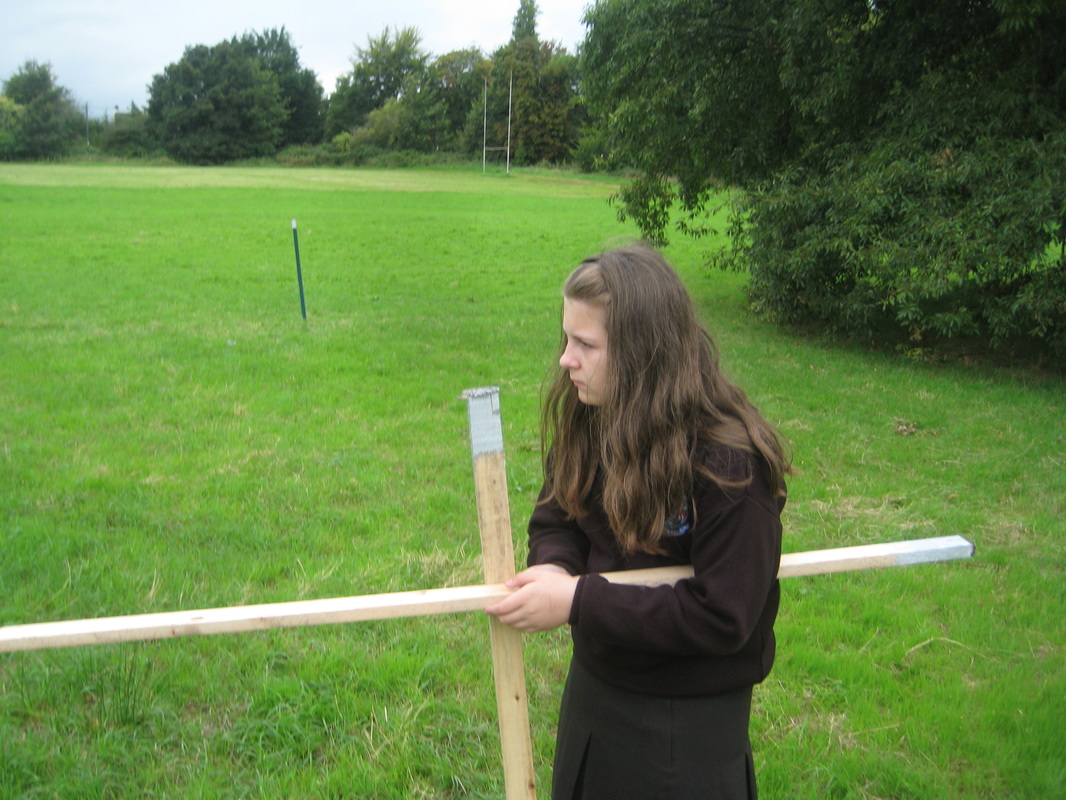
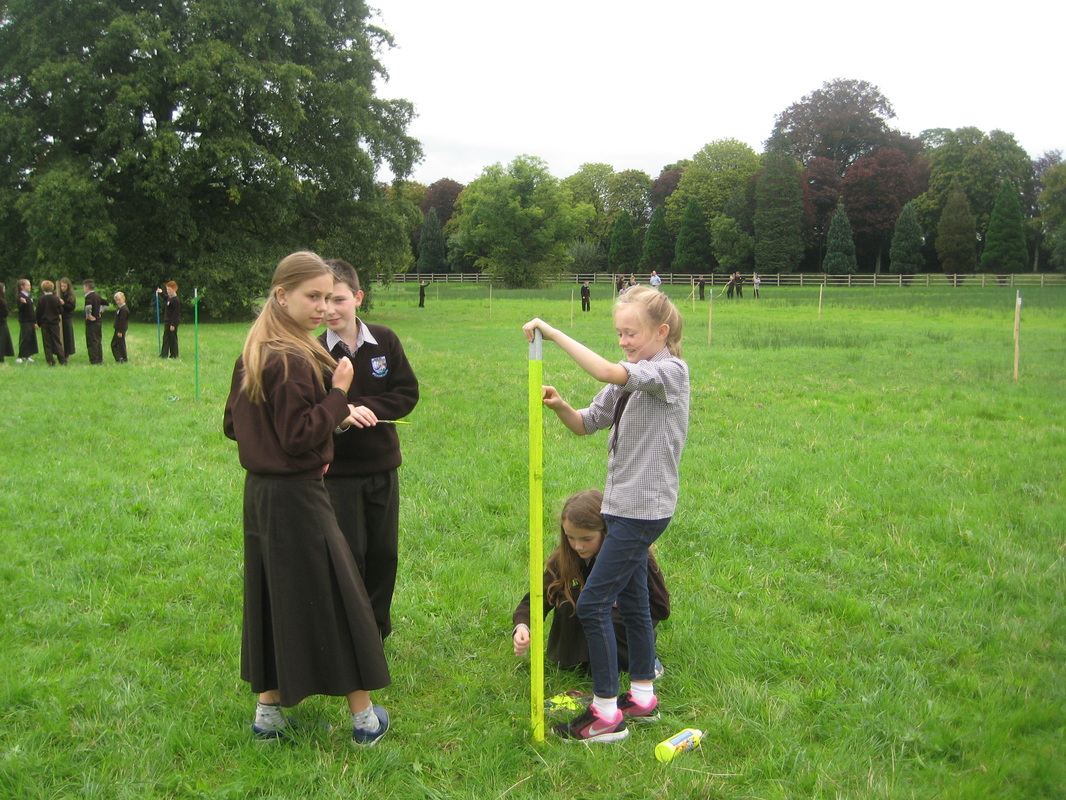
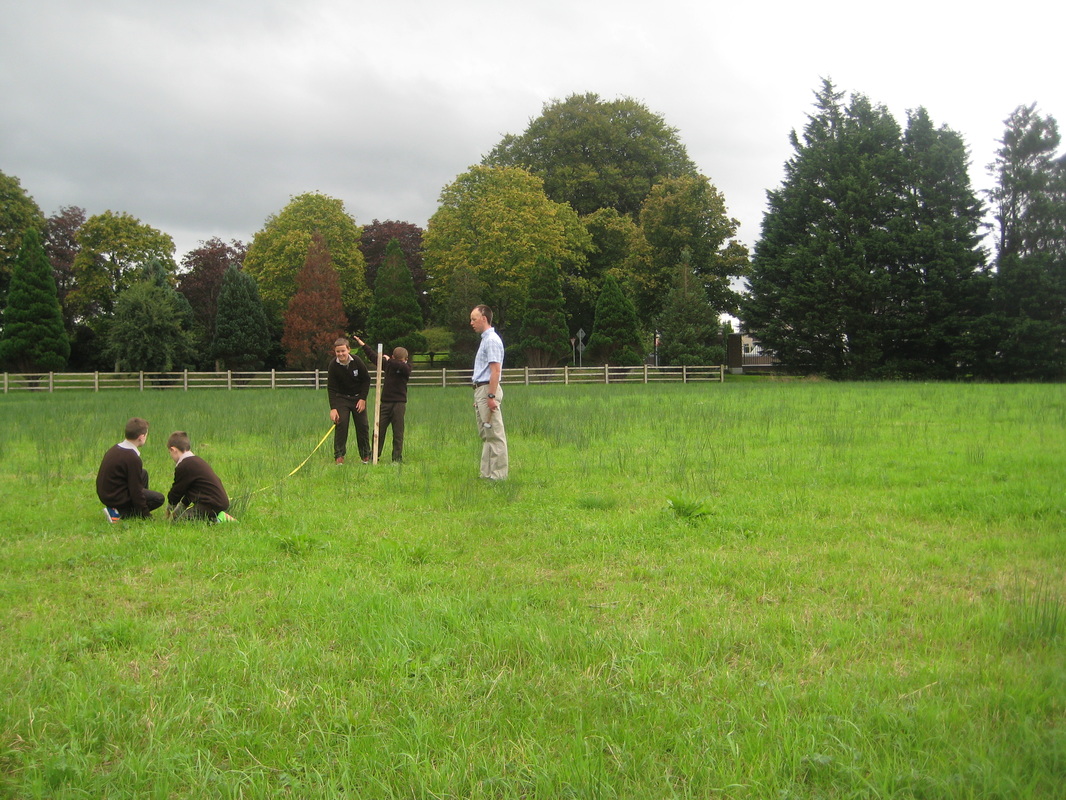
This was one of the most technical investigations we carried out thus far in our project. It involved some basic civil engineering using a laser, spirit level, tape measure and 2x1 timber batons. Once again the children worked in groups. The plan was to find 3 levels up from the lowest point of the wetland i.e. the centre. The three heights would be +30cm, +60cm & +90cm.
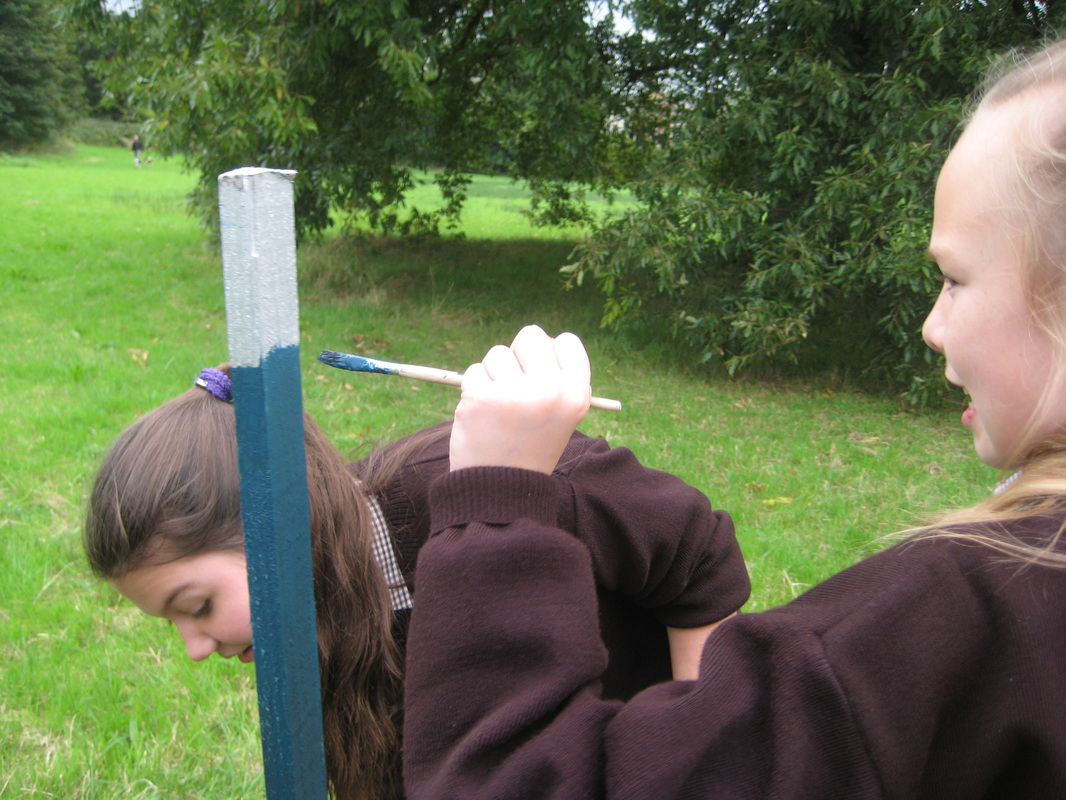
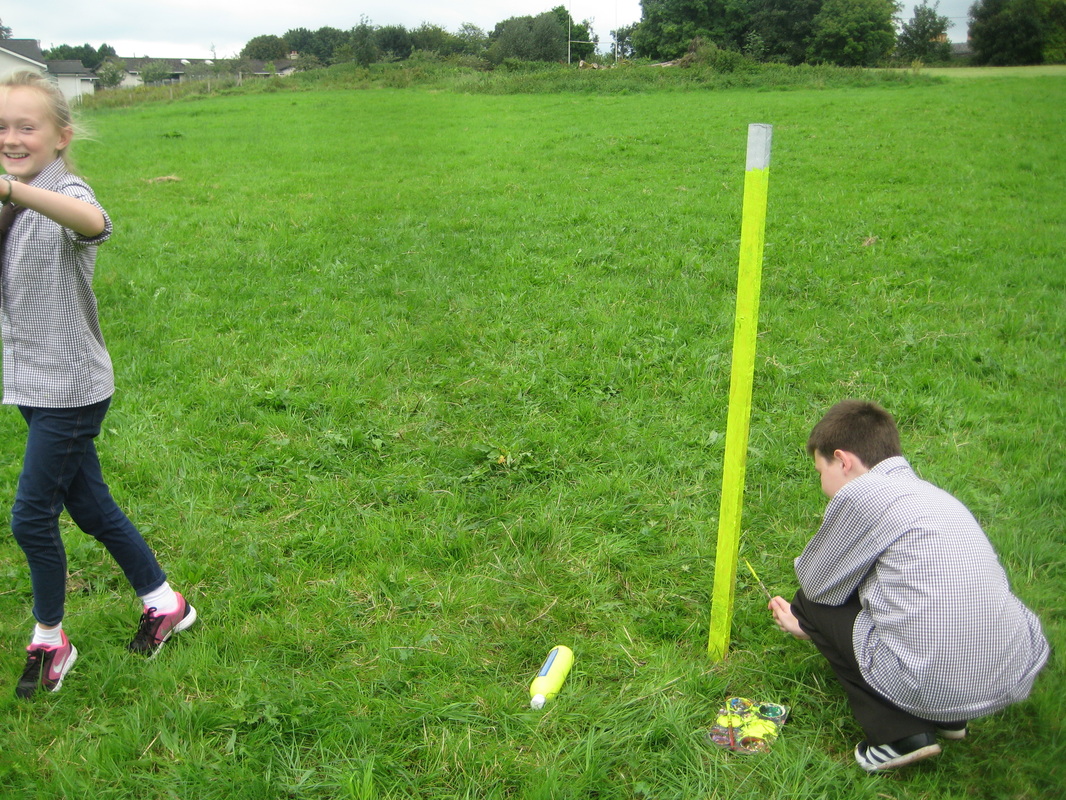
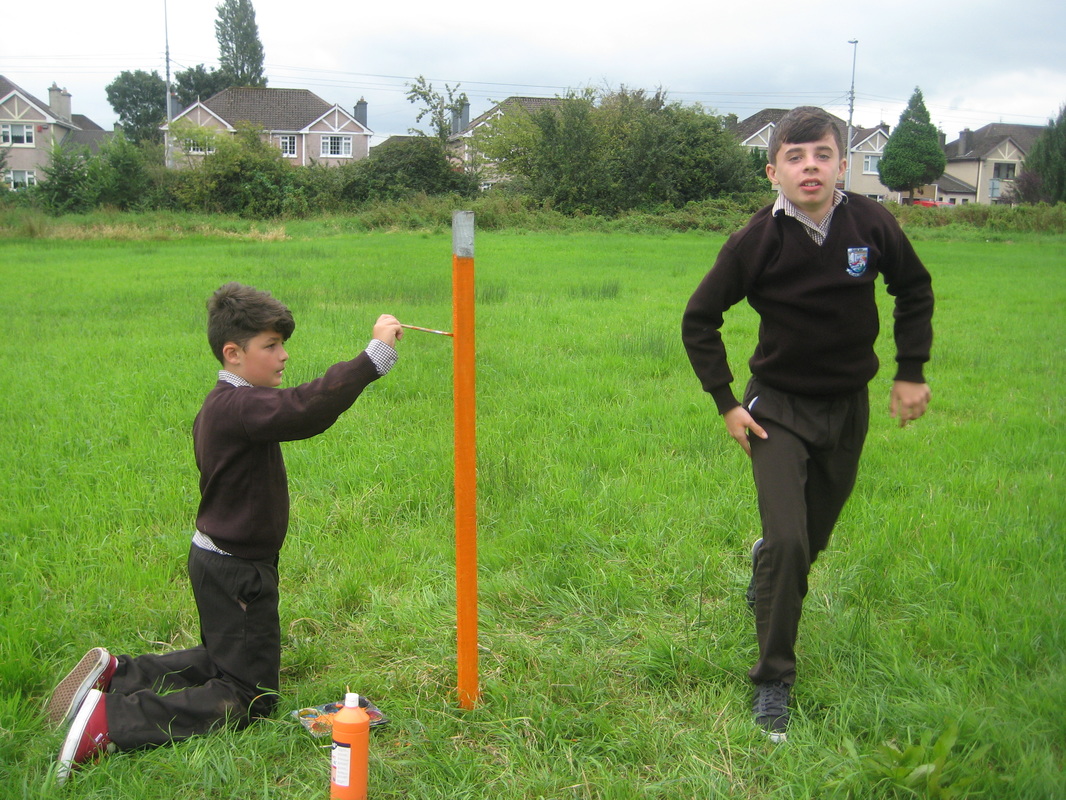
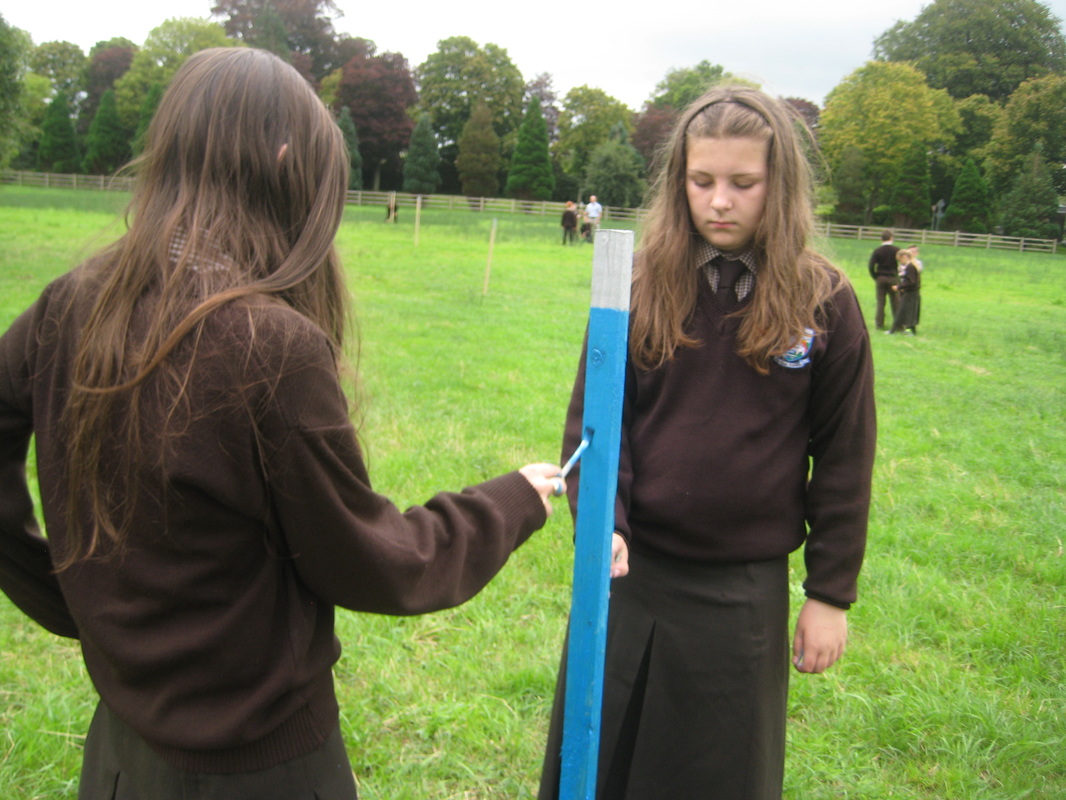
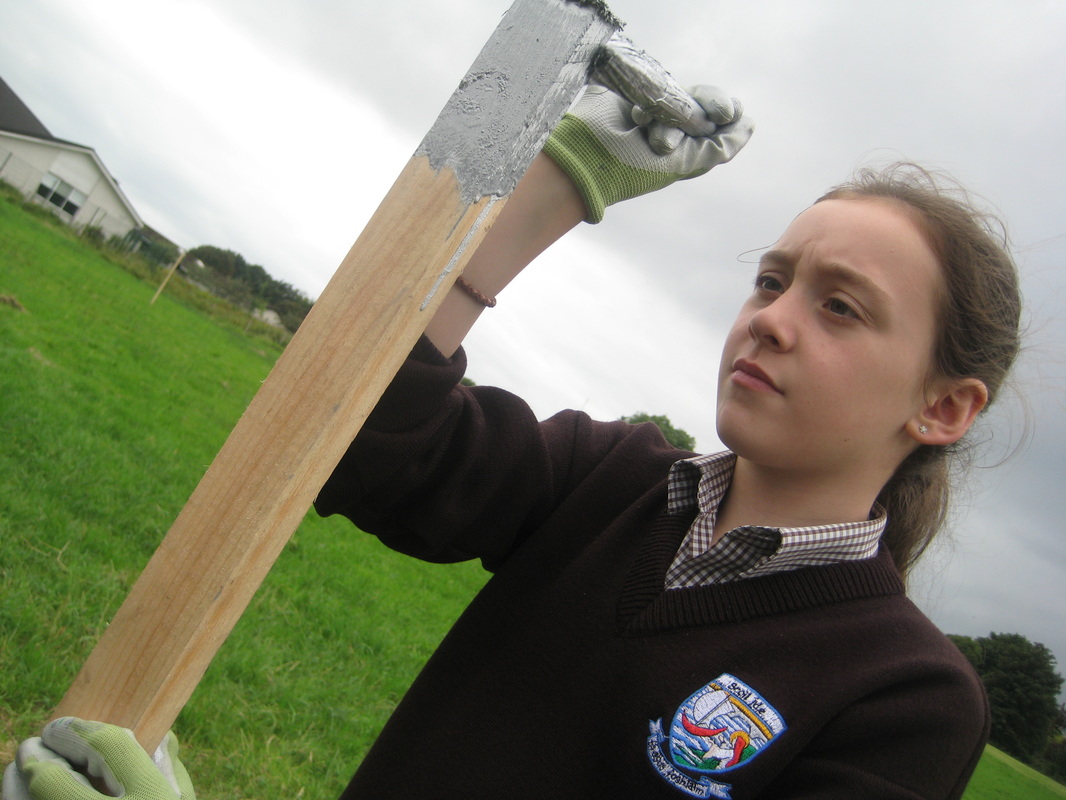
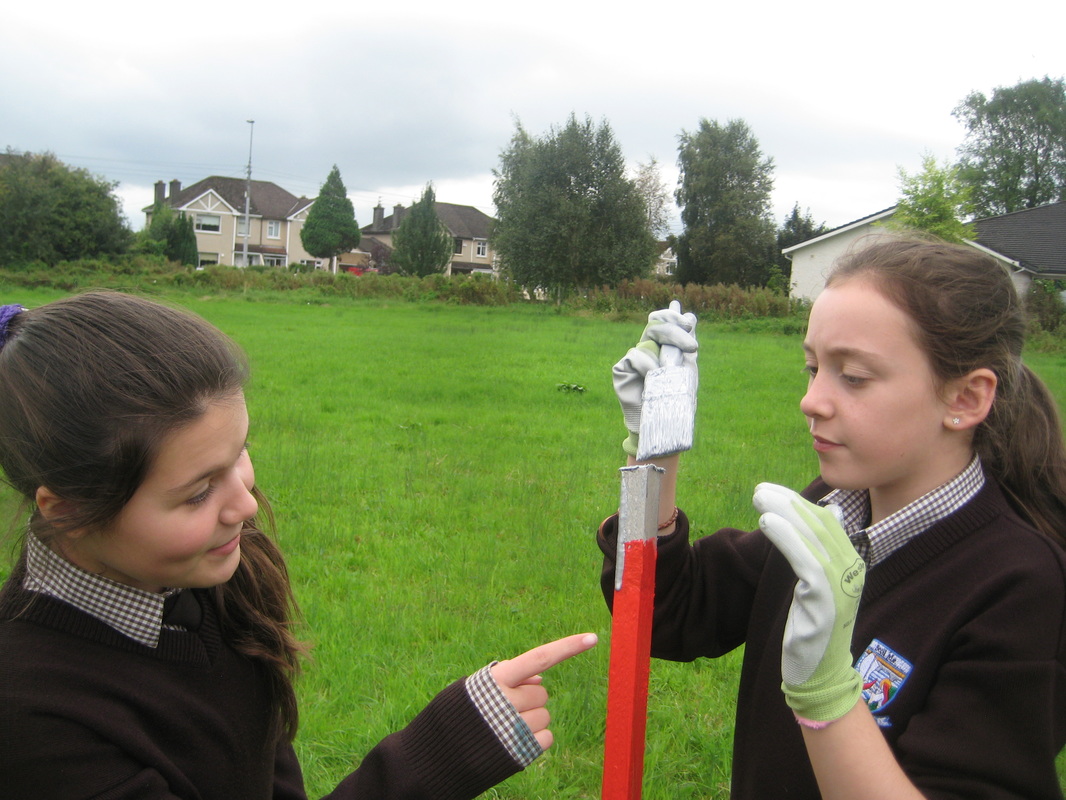
We again drove the 2x1 timber batons to mark the spot of each point, colour-coding them yellow, orange & red.
We have already seen with our Worm Count that the quality of soil & water content had a big bearing on the number of earthworms present in the soil, with the number decreasing towards the lowest point of the wetland. We will have to see if the contours here can be overlaid on flower / other plant studies later in the year.
This was one of the most technical investigations we carried out thus far in our project. It involved some basic civil engineering using a laser, spirit level, tape measure and 2x1 timber batons. Once again the children worked in groups. The plan was to find 3 levels up from the lowest point of the wetland i.e. the centre. The three heights would be +30cm, +60cm & +90cm.
We again drove the 2x1 timber batons to mark the spot of each point, colour-coding them yellow, orange & red.
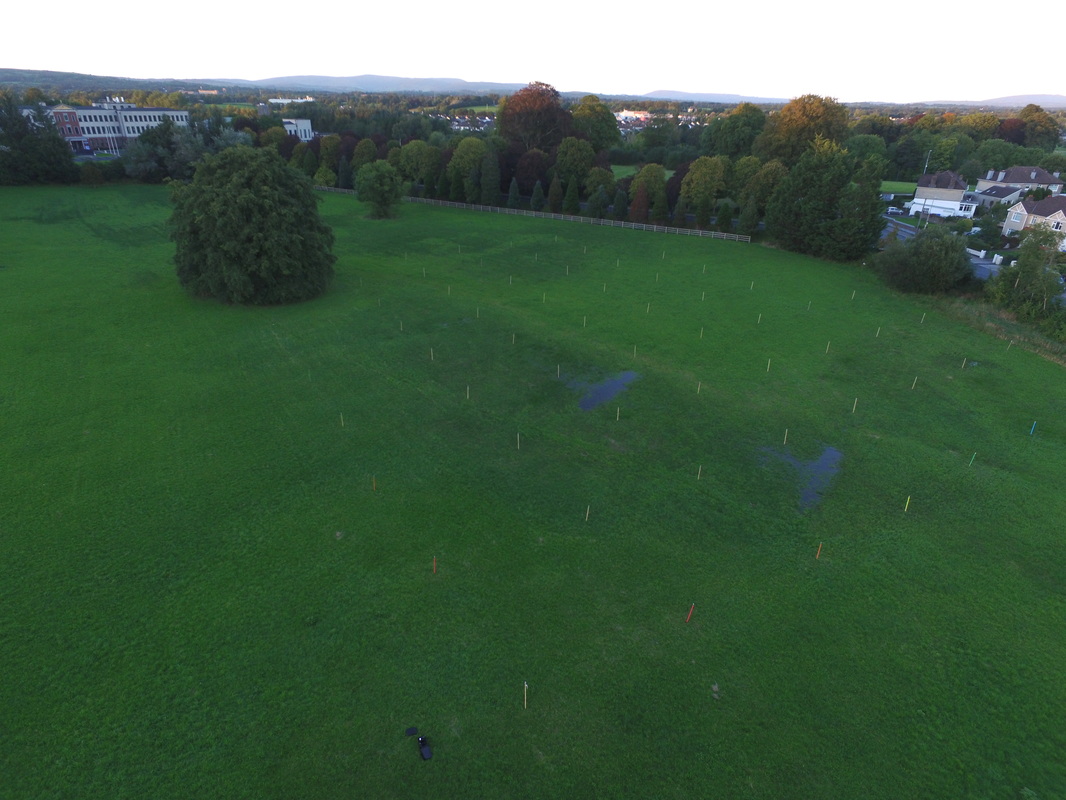
- The resulting aerial photo shows a roughly circular shaped wetland with the eastern side (towards Corbally Road at the top of the photo) being much flatter.
- The contours prove that there is a depression in the land. This makes the area much more likely to flood when the water table rises in times of prolonged wet weather.
- We noticed the the +90cm contour diverges away from the +60cm contour as it heads towards the Oak tree. We know that the wetland has historically extended to the base of the Oak tree at its peak in times of extreme rainfall. This can be seen in the shades of green visible in the July time-lapse photo at the top of this page.
We have already seen with our Worm Count that the quality of soil & water content had a big bearing on the number of earthworms present in the soil, with the number decreasing towards the lowest point of the wetland. We will have to see if the contours here can be overlaid on flower / other plant studies later in the year.
|
History
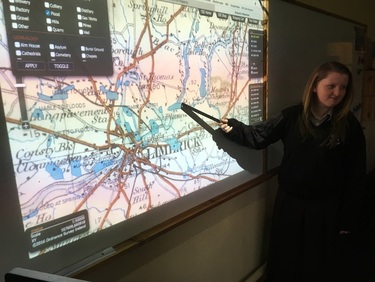
While trying to show the class examples of contours on some OS maps, we strayed into the historical maps on the Ordnance Survey Ireland website. As you can see from the image on the right we were able to use an overlay feature on the map to view areas that were identified as being flood plains. The map did not show any flooding in our wetland area so this proves to a good extent that the wetland is a relatively recent phenomenon. Interesting to see how our local waterways differed in the 19th century with the biggest noticeable difference being the absence of the Ardnacrusha Hydro-electric Power Station and tailrace canal. The Shannon river which flows by the school would have been much larger and more navigable then. Thanks to Graham once more for taking the aerial photo at short notice during a weather window. |
|
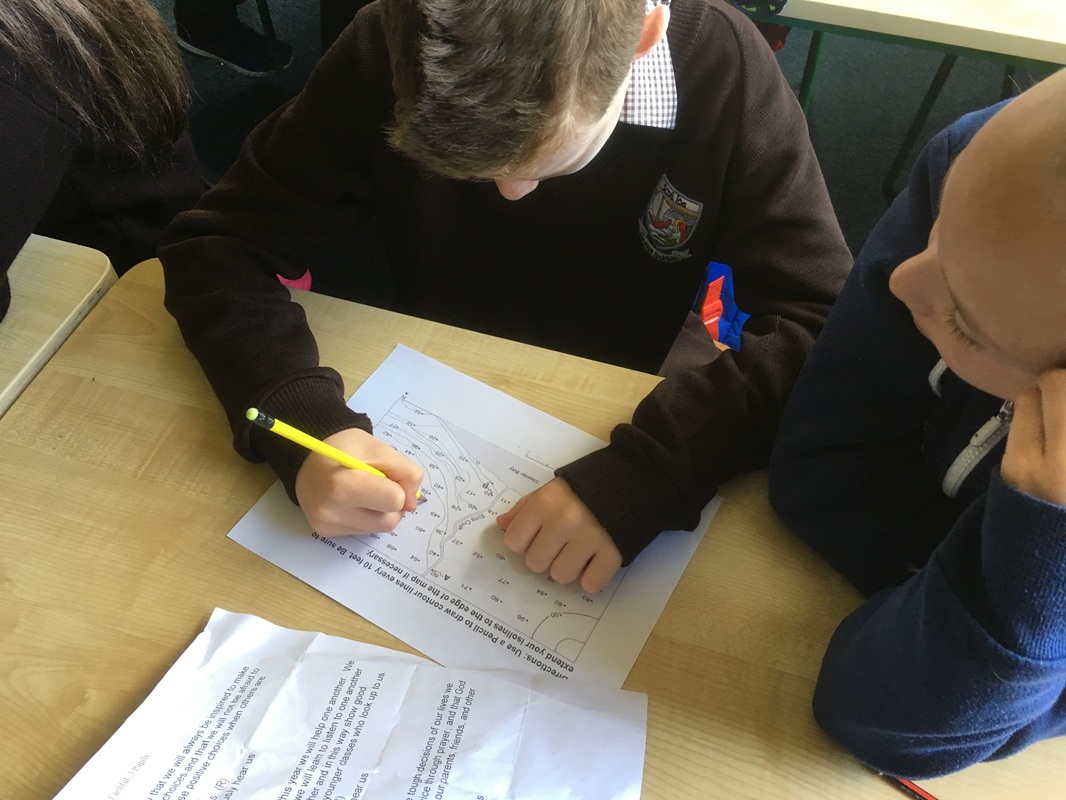

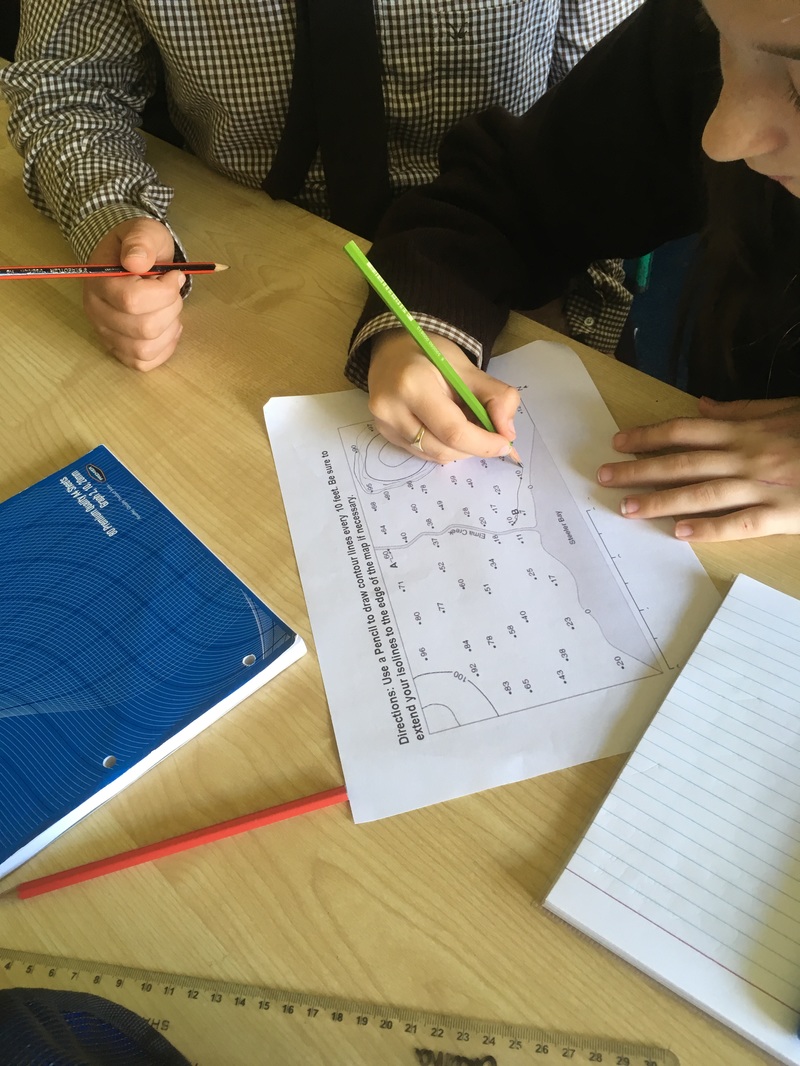
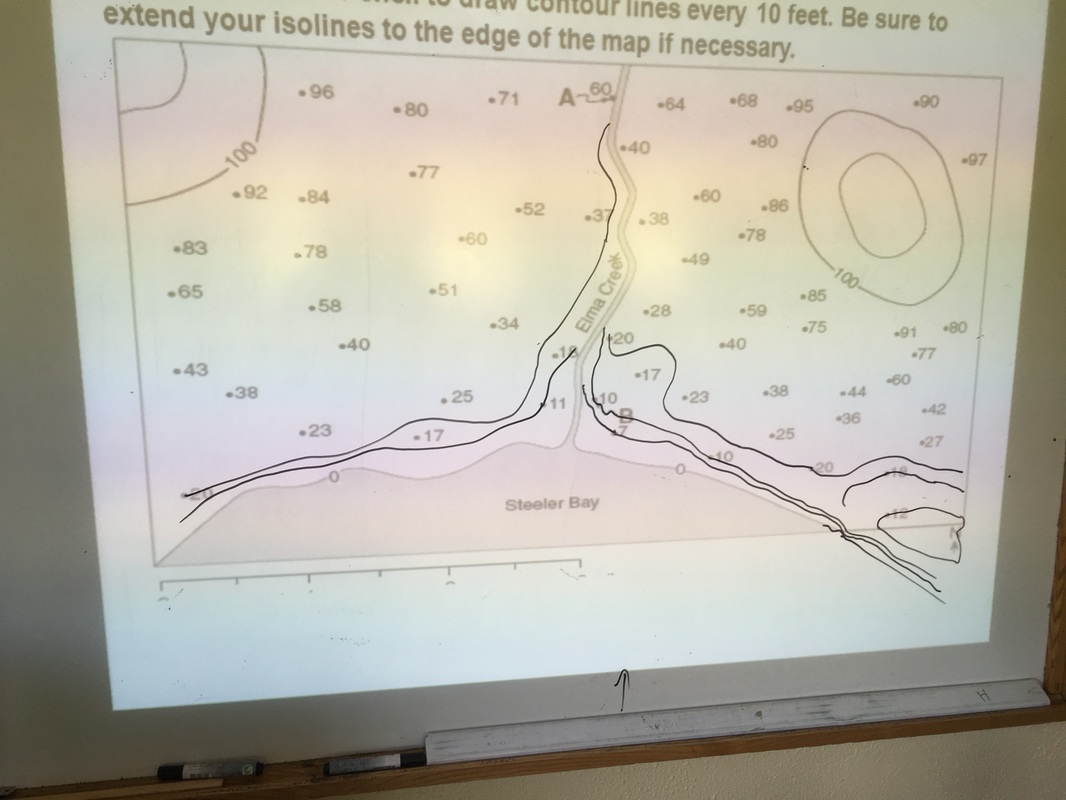

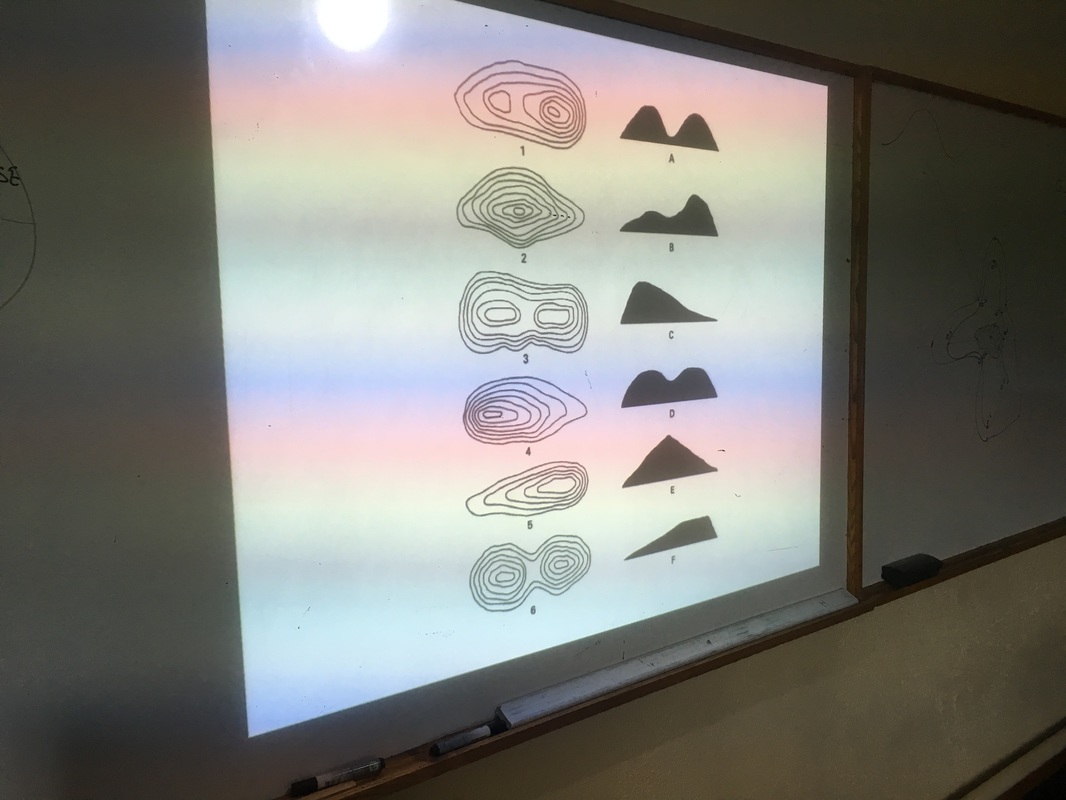
Lesson on contours
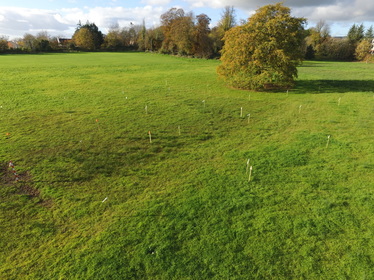
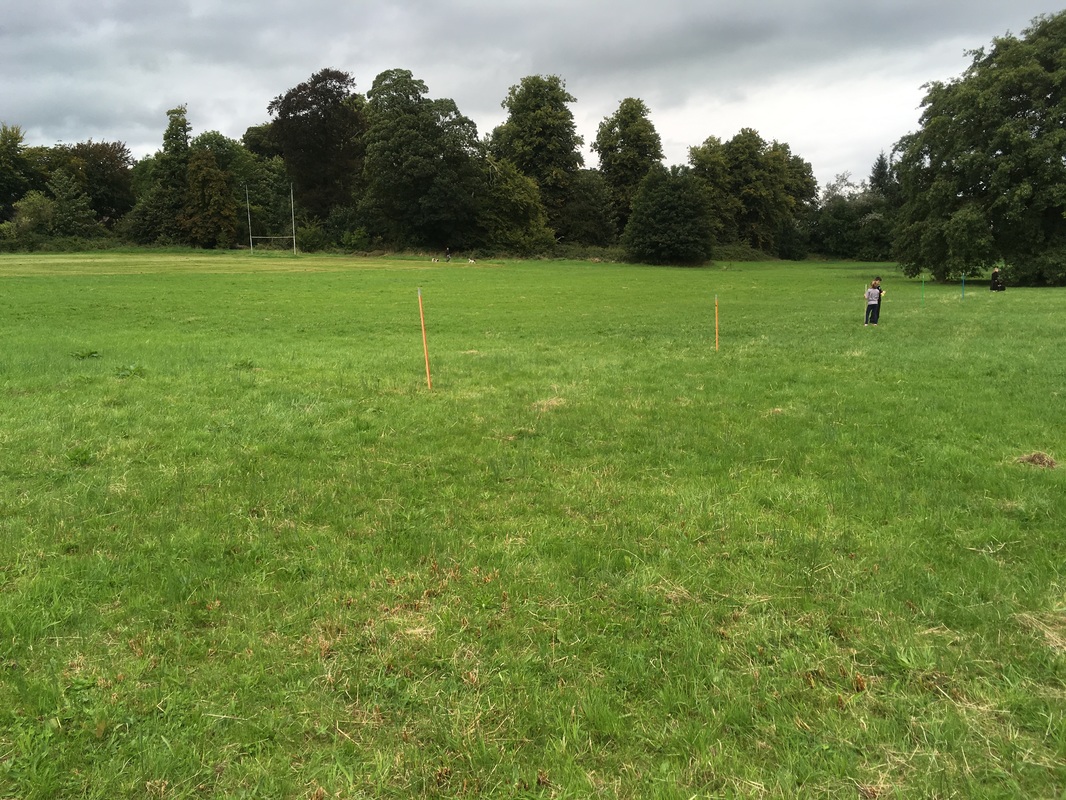
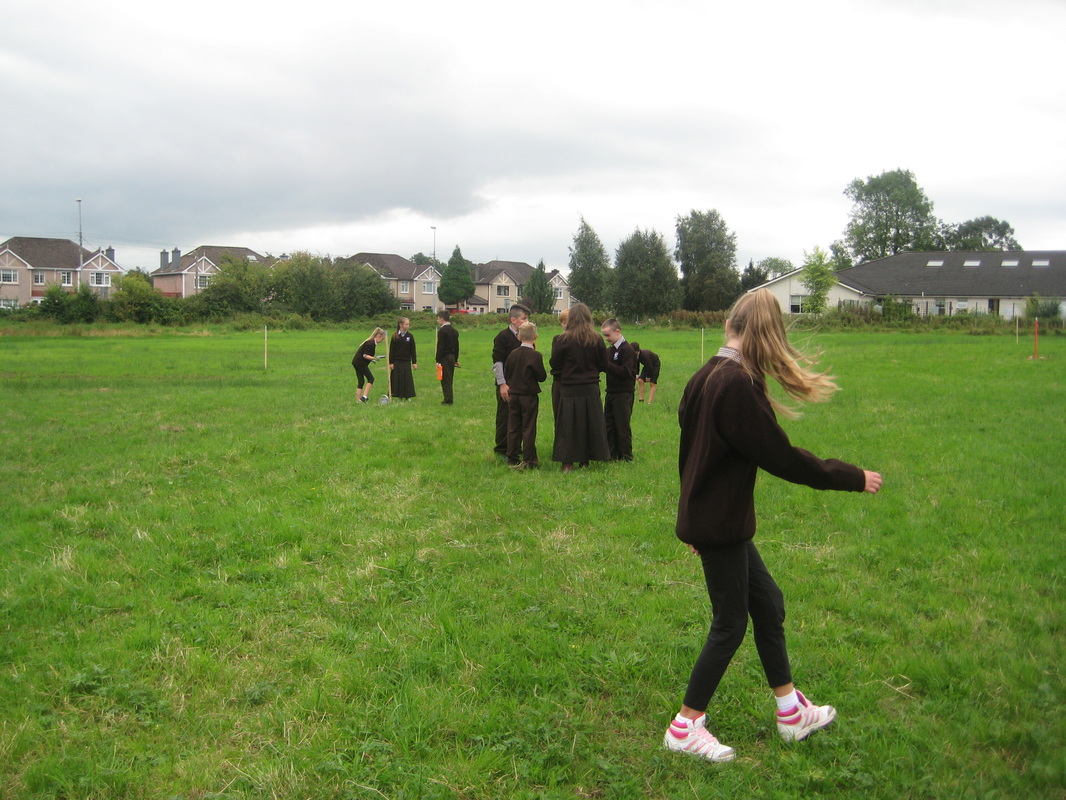
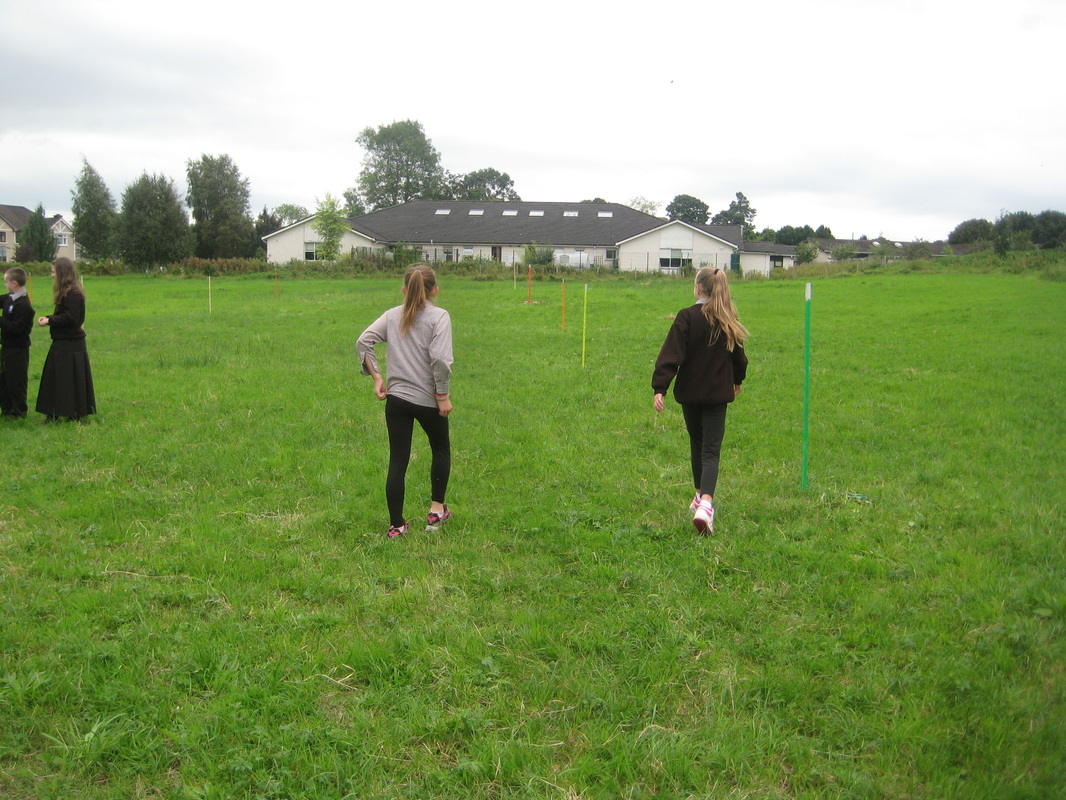
Out in the wetland marking out the positions for the contour stakes.
Depth Pole
Thursday 15th September
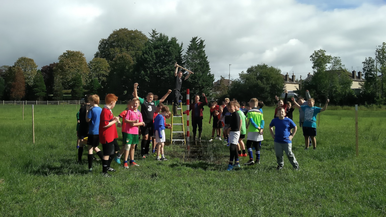
This is the pole which we are erecting in the lowest point of the wetland. We will use this depth pole to mark the deepest point and to take official depth measurements of the wetland. Thomas had the idea of using permanent marker to graduate the pole in centimetres so that we would be able to take readings of the depth by using binoculars to inspect the pole from the edge of the water (The depth may get so deep that wellies would not suffice!) This may prove a very good idea in the months to come if our winter is anywhere near as wet as last year's.
|
|
|


We placed it in position after rugby training on Friday 17th September the boys all mucked in, helping to carry the stepladder, sledgehammer, crowbar, and of course the pole itself. Mr. D'Arcy did the sledging and gave it an extra belt for every storm we had last year. It's there to stay until Summer 2017.
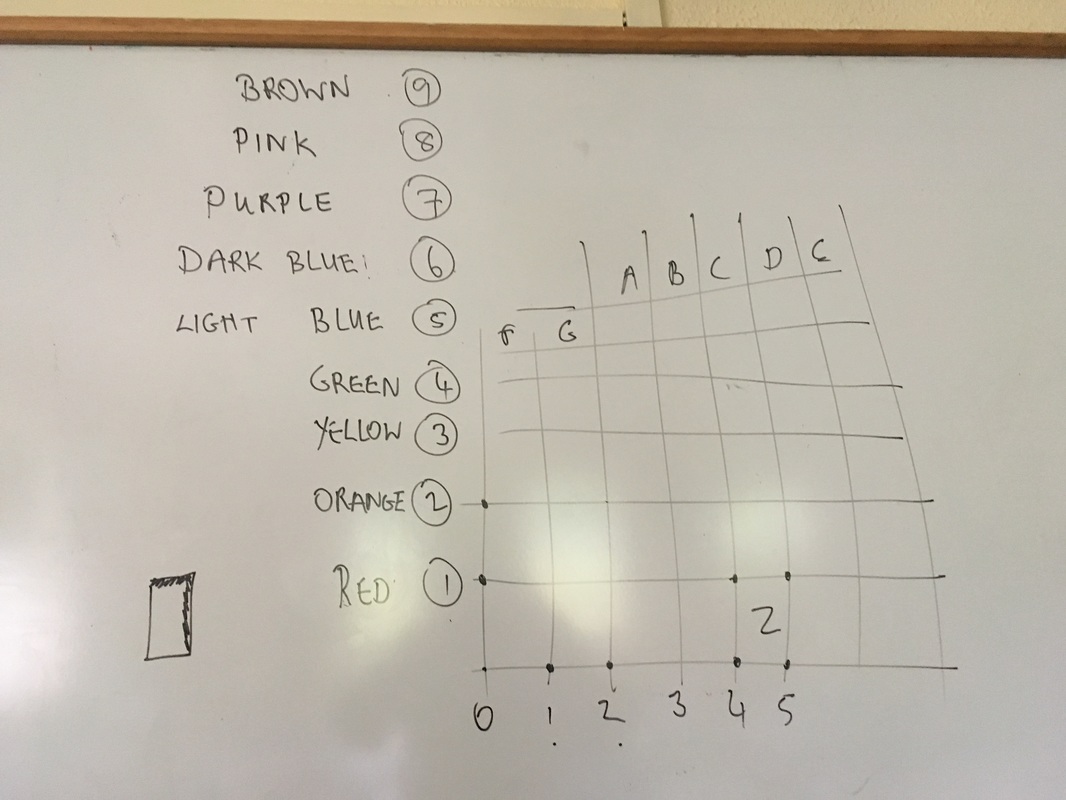
Grid system
Mapping contour of pond
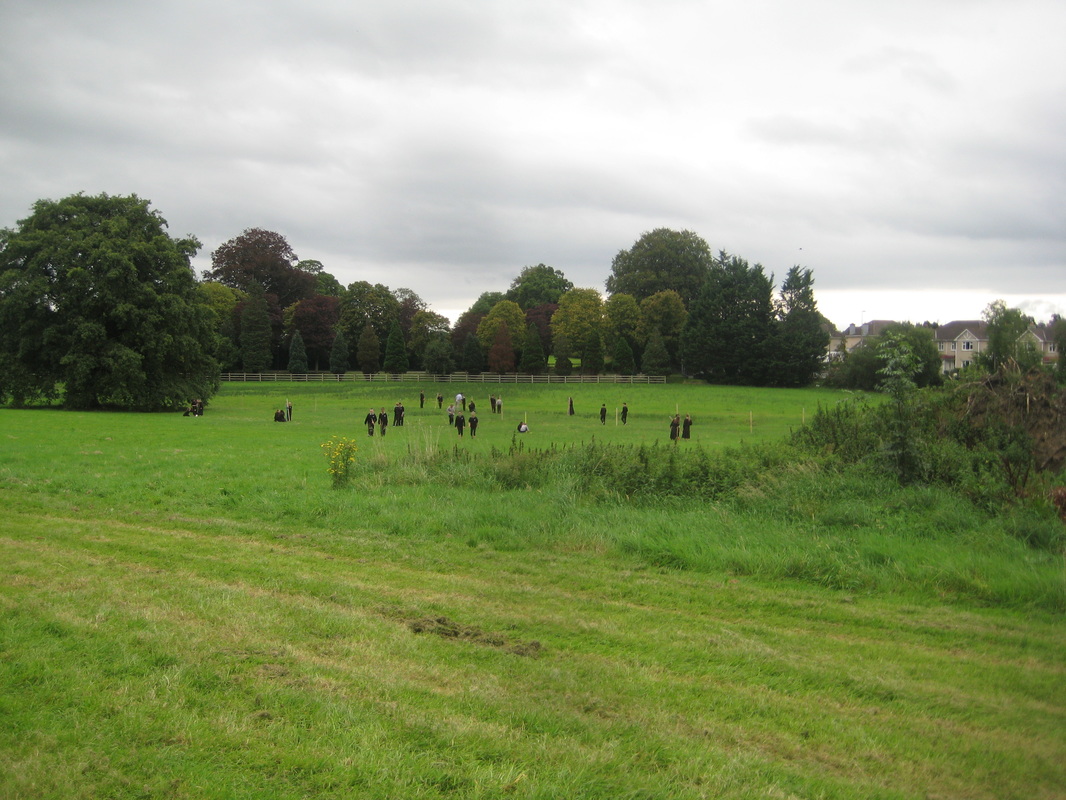
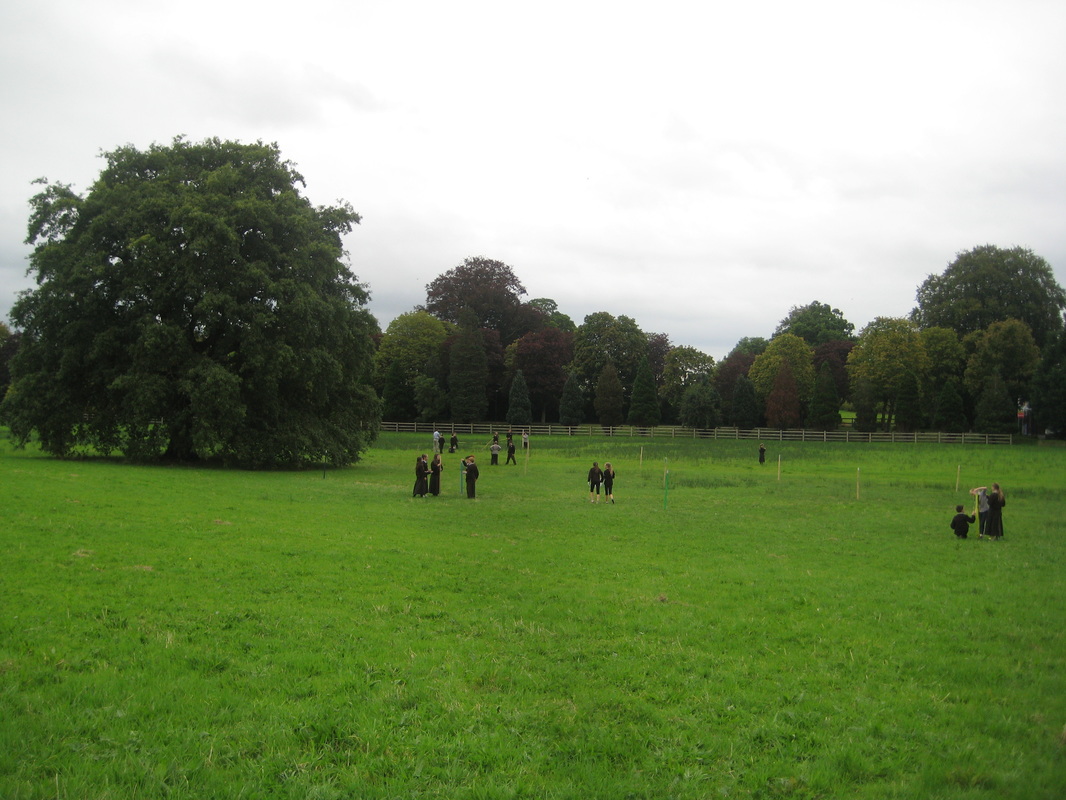
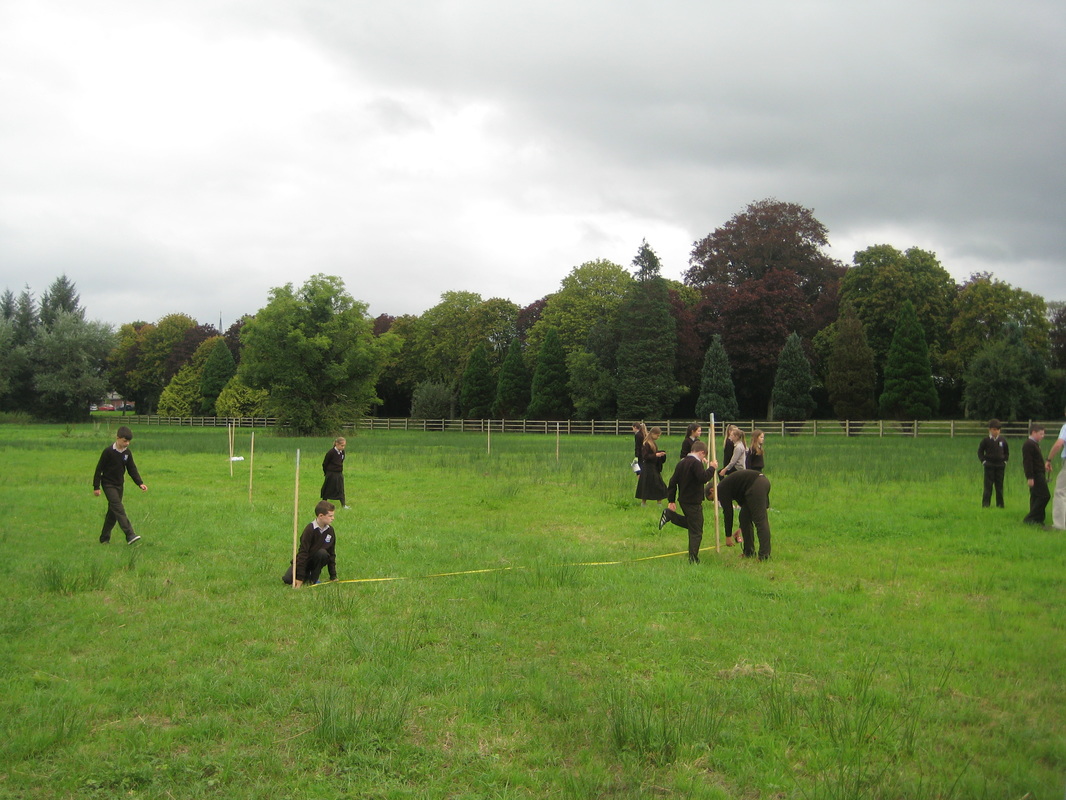
We plan to use a grid system to map the low-lying are of the Bishop's Field. Timber stakes at 10 metre intervals will make a 90m by 90m approx. grid. This means that the contour of the pond will be measurable and we can compare the aerial drone photos that we take as the year progresses.
This will also mean that the data will be easy to graph in the children's graph copies.
We hope to create graphs of
We hope to create graphs of
- The contour of the pond (multiple contours over time)
- Cross sections of the relief of the wetland.
- Rainfall bar graph.
Below is a photo taken on 13th September when we have almost all our stakes in place for the grid. (See video flyover of this by clicking here.)
Correlating weather data with measurements of wetland.
Our weather station (situated adjacent the wetland in our Outdoor Classroom) broadcasts a plethora of meteorological data to the Skyline website every fifteen minutes. A fantastic resource at our fingertips.
http://skylink-pro.com/remote-index-sitemap.php?domainname=scoilide.ie&keyword=corbally With rainfall weekly totals we would hope to see a correlation between the area of land underwater and the amount of rainfall. |
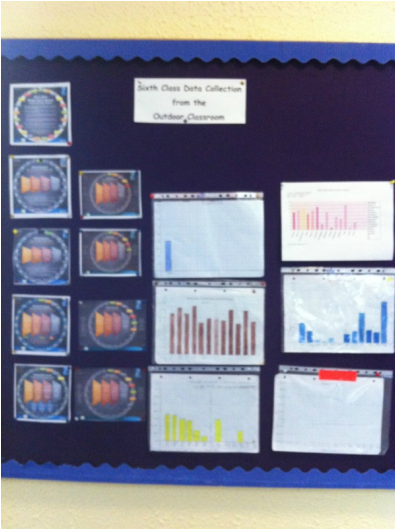
Some graphs based on weather data from our weather station.
|
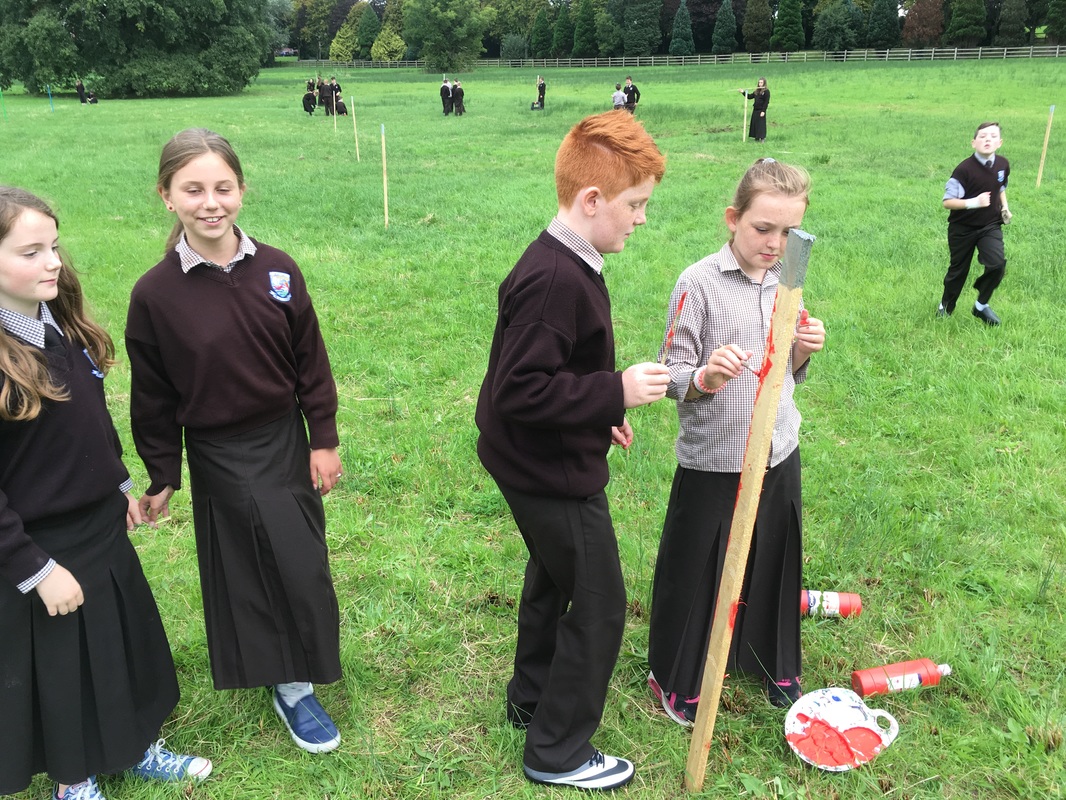
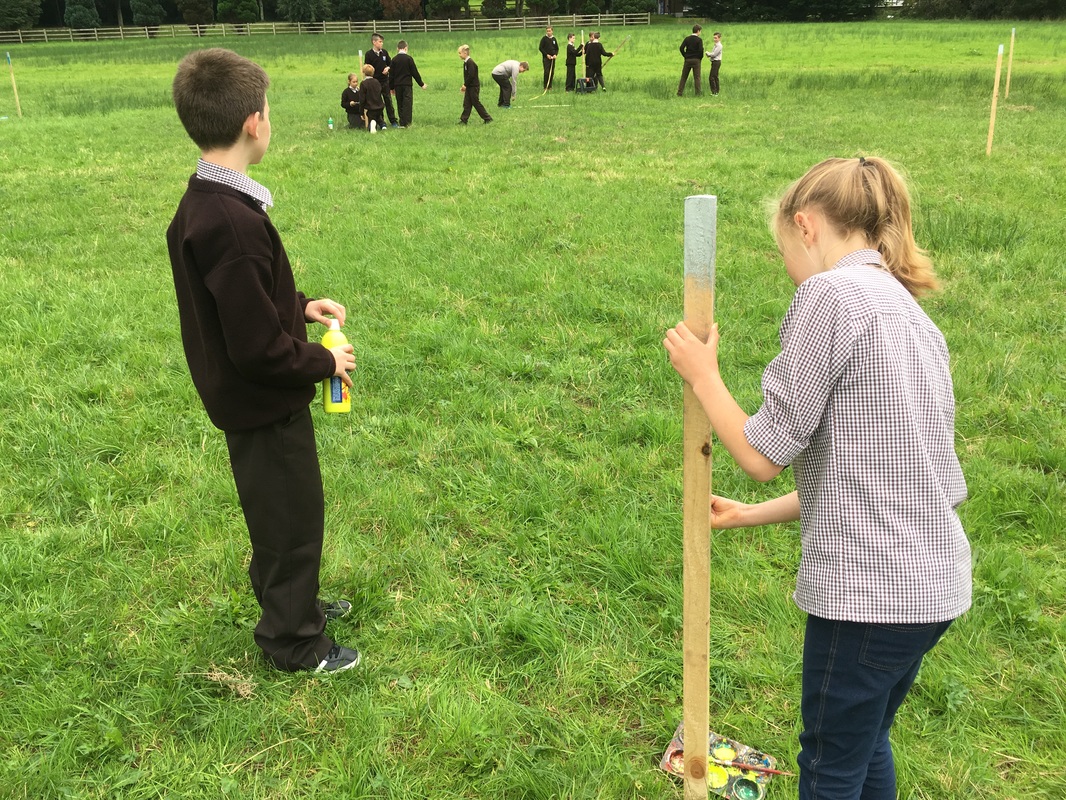
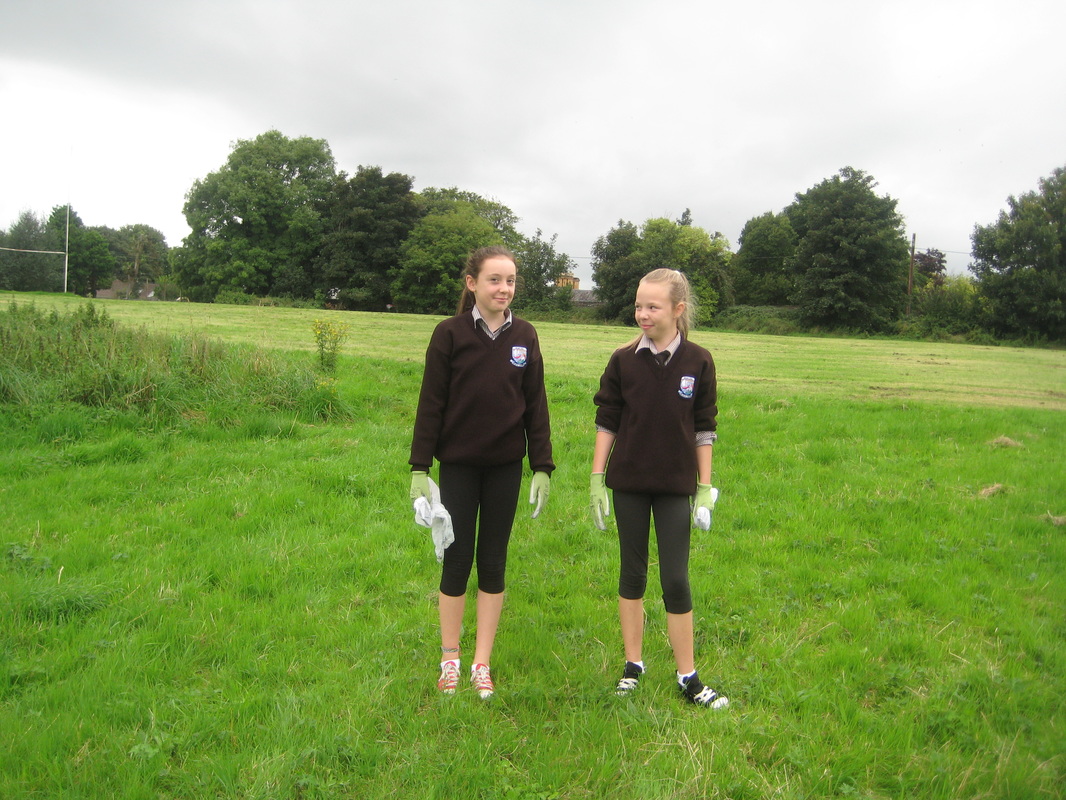
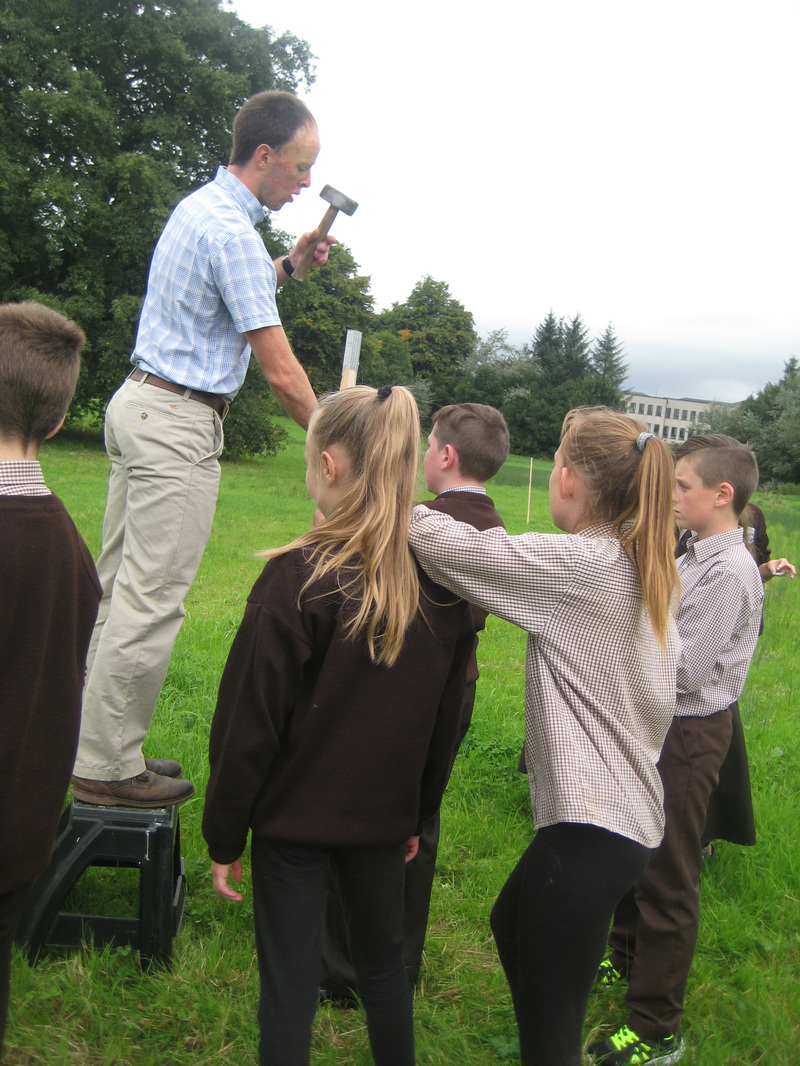
A lot of cutting, measuring, checking the compass, hammering, painting, and fetching more stakes!
Below is a gallery of images of the class working to establish the grid.
Below is a gallery of images of the class working to establish the grid.


|
A short clip of great team work on display to mark out the stake positions and paint them on day 3.
|
|